Stats Definition: Statistics is the discipline focused on gathering, arranging, and interpreting data.
Data: facts or pieces of information.
(OR)
E.g: 1. height of student in the classroom
- No. of sales in terms of revenue of a company
- IQ of students in the classroom
Types of statistics:
- Descriptive Statistics
- Inferential Statistics
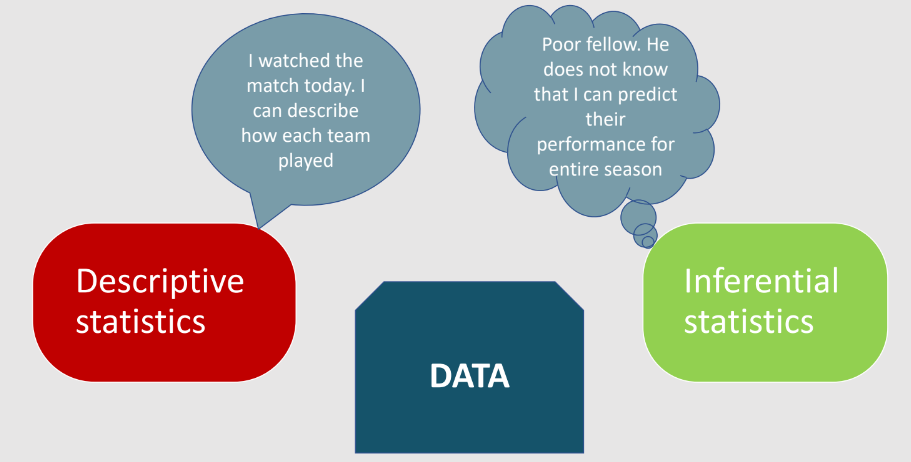
1. Descriptive Statistics : It involves the processes of organizing, summarizing, and visualizing data
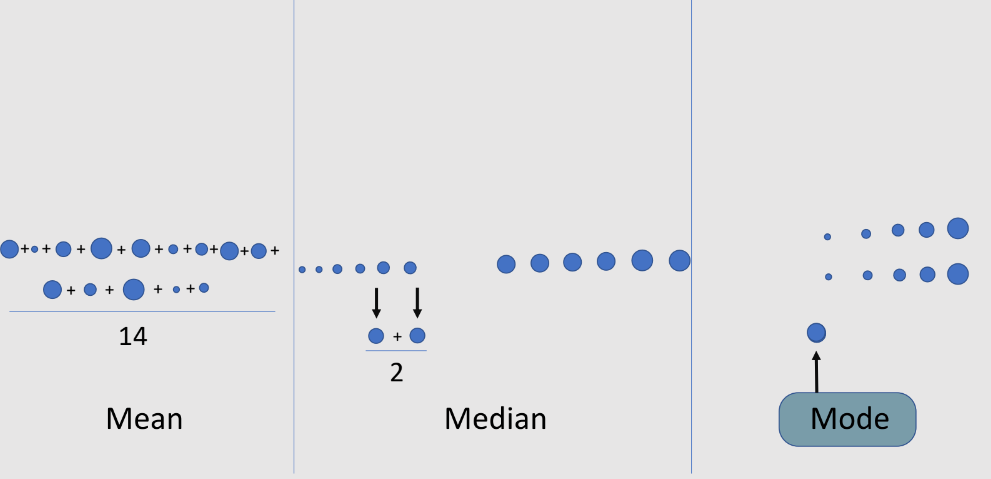
I. Measure of Central Tendency: –
II. Measures of Dispersion: –
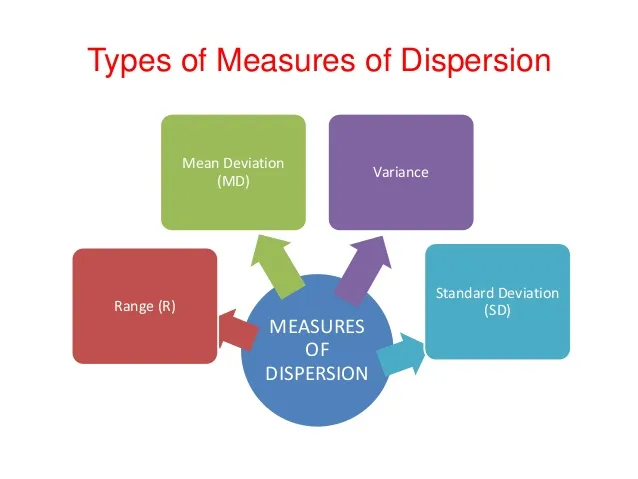
Range: The range is the difference between the highest and lowest values in a data set.
Range = Highest Value – Lowest Value
Why Does the Range Matter?
The range can give you a quick idea of how varied your data is. A small range means everything is pretty close together. A big range? That means there’s a wide spread between your smallest and largest numbers.
However, keep in mind the range has its limits. Since it only looks at the two extreme values, it doesn’t tell you much about what’s happening in the middle.
Mean Deviation : Mean deviation is a way to measure how “spread out” or dispersed data is around the mean (average) of a dataset. It is also known as the average absolute deviation.
Mean Deviation= ∑∣xi−mean∣ / n
Why Does the Mean Deviation Matter?
Its a tool for understanding variability in the data. For instance if you are checking at your exam score, Low mean deviation? Your marks are close to the mean. High mean deviation? Your marks are more distinct to the mean.
Variance: This concept helps us to understand the how spread our data is ?
If the variance is too high it leads to over fitting. It reflects the sensitivity of the model and the data points are more spread out from the mean. If the variance it means that the data points are close to mean.
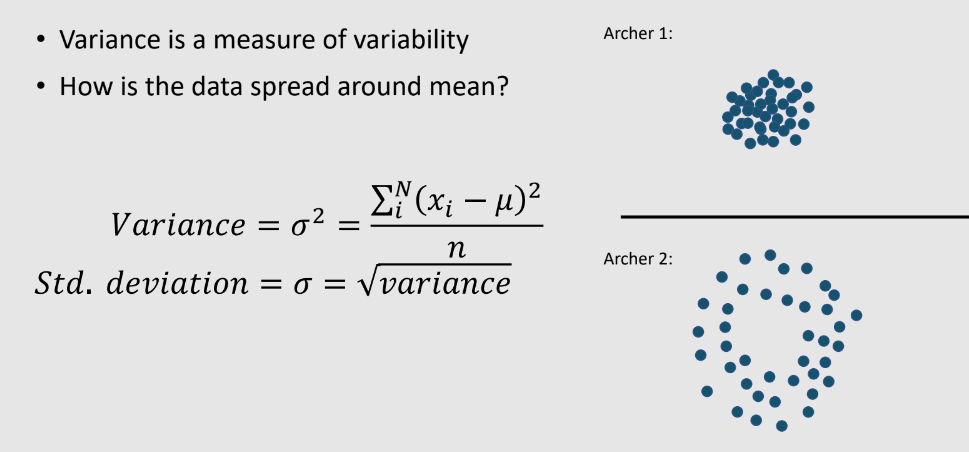
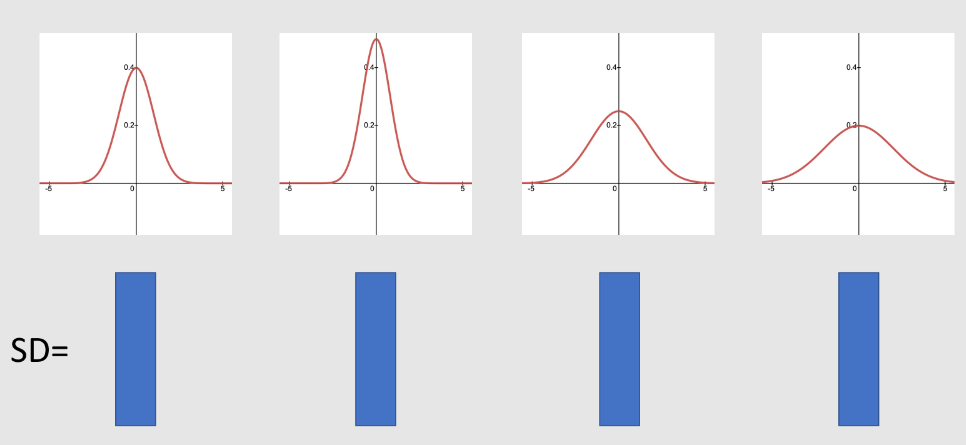
Standard Deviation: A standard deviation is measured the how dispersed data is in relation to the mean.
The standard deviation can be a positive.
Advantages of standard deviation:
Standard deviation is crucial because it helps us to understanding the measurements when the data is distributed.
If the data is more distributed, the greater will be the standard deviation of that data.
It was helping out for calculate the margins of error that occurred in the mid-survey reports.
They are two types of standard deviation:
- Low standard deviation : It describes that data is very close to the mean
- High standard deviation : It describes that data is more spread out to the mean.
Variance And Standard Deviation
In Data science the data must be classified into two types,
Numerical And Categorical data:
Numerical data : we also called as quantitative data. The data which is measured and using for mathematical calculations, They have two sub types:
Discrete data: We can count the numbers between two points of intervals is called a discrete interval. In the World Trade centre every day approximately 200 trains have been departed towards Newark.
Continuous data: The data which have an infinite number of values is called discrete data. For instance, The weight of the person is 5.46,5.47,4.76 those are measurable quantities.
- Height
- Religion
- SSN
- price of product
- mileage of car
Categorical data: We also called it qualitative. It describes the properties that can be divide into the categories. That are not numerically related.
Nominal : In this categorical type does not have any order. For instance, Gender(male,female, binary).
Ordinal: These have a clear order but the intervals between the ranks may not be equal. For example, economic status (low, medium, high).
- Gender
- Marital status
- Type of Movie (Action/romantic)
- Religion
- Ethnicity
- pincode